
Becky Malby and Guest Blogger Tony Hufflett (who wrote most of this!)
Understanding Who Attends Frequently
We know that the people who turn up frequently (frequent attenders) in General Practice are now who we think they are. In my last blog on this topic Frequent Attenders – Breaking the Cycle in Primary Care we shared that about about half of these people are ‘struggling with life’ and not the stereotypical ‘complex chronic co-morbidities’ that typifies the discussion about how to manage them.
Since then we have looked a deeper at the data from across a dozen practices. What surprises us overall is how little is known in any general practice about who these people are and why they attend. What we see is a pattern of generalising the narrative about people who attend frequently from the few who are practically camped out in the practice (the outliers). Tony refers to this as ‘anchoring bias’(1). These 5-10 people are the exception not the rule for frequent attendance.
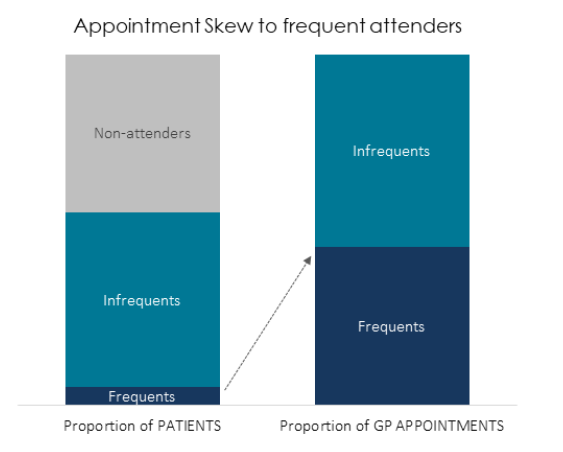
So who are the majority of people who turn up frequently – the small proportion of people that take up the majority of appointments?
Universally we see that around 5% of a practice’s patients will use around 30-40% or more of GP appointments. These will be a range of weekly to monthly patients – frequent attenders who come 10-30 times or more a year to see a GP. In my last blog I set out how to understand and meet these people’s needs.
We find it helpful to zoom in on the top 100 patient attenders at a practice, to ask the practice to review and spot patterns. It’s a large enough number to escape from individual extreme cases.
In these top 100 patient attenders we will see huge variation between practices:
- Mental health conditions: as few as 10 to as many as 50 patients with registered MH conditions
- Two or more long-term conditions: from a majority to a minority of the 100
- No coded long terms condition: from 8 to 40
- Aged under 60: as few as 20 to as many as 80
This variation plays itself out very similarly in percentage terms among all people who attend frequently not just the top 100. The nature of frequent attenders is very diverse – young vs old, clinical vs social factors, mental health prevalence and so forth is hugely variable.
There are many ways of looking at this – below for example are five broad typologies of frequent attenders and their prevalence in some practices, some of which are only a few hundred yards apart:
Example variation in typology of frequents across 8 London practices:


But here is the key issue that surprised us.
This variation can’t be explained by population type, it’s more associated with practice’s behaviour than the demographics or health profile of the population.
Of course, a practice’s list demographic and environment will influence this, but it is clear that the system of access and practice priorities and systems are even more dominant. This means that the practice is co-creating the attendance pattern of people who attend frequently.
Most of your top attenders this year will not attend so frequently next year.
That doesn’t sound right does it? But it’s a phenomenon called ‘regression to the mean’. Data shows that only about 30-40% of people attending frequently are long-term consistently high attenders. So sadly, “fixing” these individual cases, outside those 30%-40%, doesn’t fix the skew of resources, and in fact doing nothing at all will make most of them attend less in a year’s time. However, their place will be taken by someone else. Your pattern of top attendance will look the same in a years’ time but with different patients in it
Real improvement is not about fixing individuals, it’s about spotting patterns, understanding cause and making lasting changes and improvements.
Learning: Practices need first to understand who their frequents are; the different sub-groups within them and most importantly how the practice itself is creating these patterns.
What can the Practice Do?
We set out the key starting points in my previous blog:
- Determine who they are and finding out what they need.
- Collaborating with your community to take an asset-based approach to meeting needs
- Providing Continuity for those it will clearly benefit
- Being clear about when acuity has tipped into the place where you need an MDT wider than the practice team (social care, mental health)
- Look after your infrequent attenders so they don’t become frequent.
Do read the previous blog – but here is an update:
Here are other things that we see directionally and that we believe to be true:
- The harder access is, the more that frequents dominate
- The larger the practice, the larger the skew tends to be.
- A&E Attendance is also high among frequent attenders. Your weekly attenders are likely to have visited A&E multiple times in the last year.
- High attendance may be created by poor continuity?
Continuity
Even in practices where there is a belief in the importance of GP constancy or micro-team work on consistency; or some attempts to create a flagged ‘usual’ doctor, the continuity data is usually still shockingly low for frequent attenders.
A “typical” person who is attending frequently, based on a median across 12 different practices will:
- Have had 15-20 GP appointments in the last year (cost to the practice over £1000)
- And seen 8-10 different GPS, none for more than 1/3rd of those appointments
- Case notes will often reveal multiple repeated tests and looped diagnoses
The only exception appears to be when there is a practice-wide strong commitment to achieving continuity and very clear system starting at reception to guide patients towards it.
What can PCNs do?
Those people who are in your top 10 are people bouncing around the system, they are turning up in multiple services. For these people whilst continuity might help, if they have an acuity which is outside the capability of a single general practice to solve you need wider support.
In my blog on the Purpose of PCNs one clear purpose was Delivering Complex Integrated Care – i.e. collaborating across practices in a place to deliver solutions together with partners (other services e.g. social care) to meet complex needs. In high performing health systems this is a core and critical purpose for collaborations in Primary Care.
Working with PCNs I suggest that every practice undertakes a ‘deep dive’ into the notes of a few of their ‘top 5-10’ frequent attenders. Make a note of what services they access when (from community to A&E to MH to the practice). List those attendances and the reasons for them. Bring these notes to the PCN meeting and together see if you can spot any patterns. Are there any issues that are common across them all? Can you see something that would help if you worked together with your partner services? These ‘complex but unstable’ patients are being failed by the current system of organising. What can you do differently that stops them bouncing around the service with terrible consequences for themselves and their families?

Too often we talk to PCNs who are overwhelmed by discussions about contracting, DES, VAT – getting sucked into the ‘old transactional world’ of the NHS. It’s a terrible waste of PCN CD skills. The work of PCNs has to make a real difference to patients who cannot be managed in a single practice.
Proactively managing frequent attenders is a win-win-win situation:
- WIN: for frequent patients themselves in terms of improved healthcare
- WIN: for the practice in terms of better use of resources
- WIN: for the rest of the patient list in sharing resource more fairly and making access easier
FAQs
What have you based this on?
In collaboration with the LSBU Healthcare Innovation Lab, Primary Care Quality Academy, we have worked in detail with 30-40 practices in London. The lab work is a year-long programme with each practice starting with a “data readiness” stage including a practice diary audit of appointment appropriateness and access turn-away rates. Many of them have also collaborated with us in a deep-dive analysis on frequent attenders where we have extracted and analyses a full dataset of appointments
Can practices do this work themselves?
Yes. There is a rich data mine in each practice’s appointment book. However, practices often don’t have the time or ability to mine it. With commitment we believe that this is self-achievable however.
Does extending hours help?
Just providing “more” doesn’t address any of the fundamental challenges and opportunities we’re looking at here.
We do see a small but significant proportion of practices (10-20%) at critical access levels – where it’s really tough for patients to get in at all. Both staff and patients are seriously stressed and it’s not a place where thoughtful improvement decisions can be made. Here the resource skew is even stronger towards those who know the system.
Further Reading
- Anchoring bias and other classic errors we make
https://en.wikipedia.org/wiki/List_of_cognitive_biases
2. Learn about regression to the mean
